
Army Phase 1 STTR joint with Navsys Inc
Project Specifications
This effort would develop a system that would address two areas of concern in tracking the location and coordinating timing of events for trauma patients. Determining the timing of the treatment of trauma patients is an important aspect of increased survivability. The effort will develop a prototype of a wearable software defined radio which can be attached to a trauma patient upon first contact by medical staff. The system will contain a software defined GPS radio as one of the waveforms, which will provide timing and location information to a central site via a wireless (Zigbee) connection. NAVSYS is the project lead doing the system design, and UCCS is analyzing the wireless networking options.
The above mentioned was the original proposal for this project. But in due course, the focus was shifted more towards conducting a comparative study of the 2 available zigbee products and performing signal strength / bandwidth tests on them. We acquired two IEEE 802.15.4 standard compliant development kits from Freescale and Chipcon and conducted tests to evaluate the performance of their respective RF transceivers. Our observations are tabulated below.
Signal strength measurements for Freescale’s MC13192 transceiver
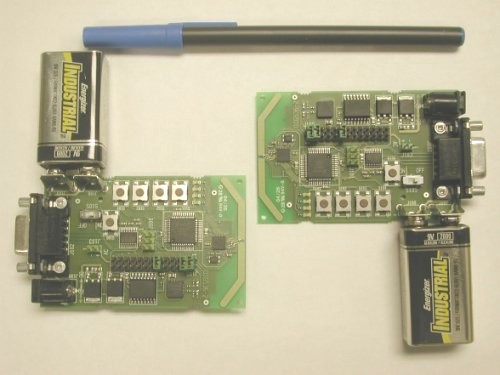
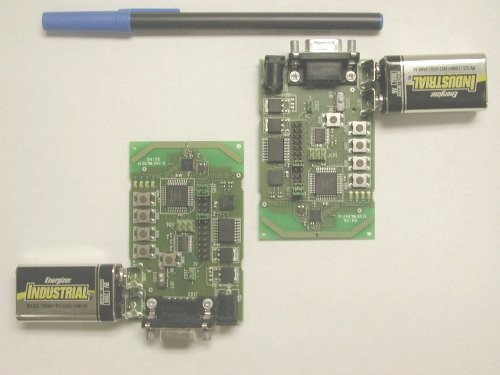
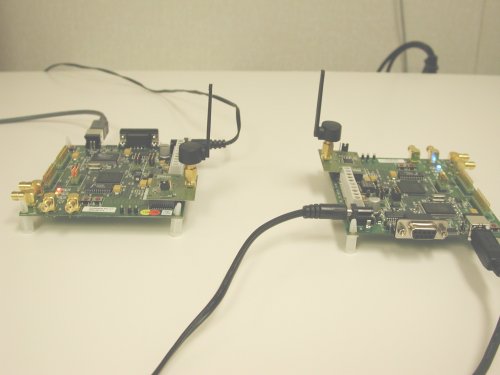
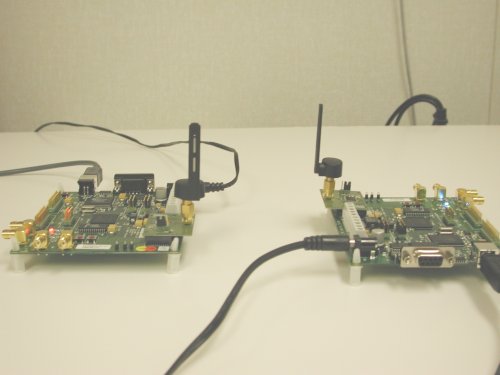
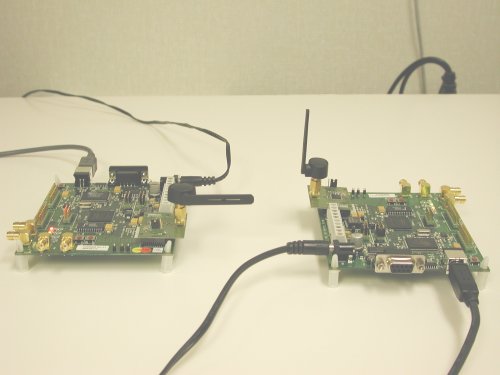
Freescale’s 13192DSK Developer’s Starter Kit came with two boards, each containing a 2.4 GHz MC13192 RF data modem, a low-voltage low-power MC9S08GT60 8-bit MCU, integrated accelerometers, a printed transmit-and-receive antenna, a BDM port for MCU programming/debugging, RS-232 port and LEDs and switches for demonstration purposes. The boards had an option of being powered by AC or by 9V DC supply. We conducted our performance tests by placing the antennas on the MC13192 boards in 2 orientations, as shown below (a 6-inch pen is used for a dimensional comparison):
 |
 |
|---|---|
| Antennas facing eachother | Antennas placed sideways |
The data for Table 1a below was obtained by testing the RF signal strength within our lab. The measurements shown are line-of-sight measurements taken with and without several wireless access points in the vicinity. The wireless APs did not seem to affect the performance of the RF boards, but the orientation of the antenna on the board was certainly an important factor. When the antennas were both facing each other, the signal strength was considerably better than in the case when they were both placed sideways. As shown in the table below, for distances between the 2 antennas ranging around 86-88 feet, the signal strength was 100% with the antennas facing each other and 66% when placed sideways.
|
S. No. |
Obstruction |
Antenna orientation |
Signal strength |
Distance (in feet) |
|
1 |
None |
Facing ahead |
100% |
86 |
|
66% |
>125 |
|||
|
33% |
– |
|||
|
2 |
None |
Sideways |
100% |
16 |
|
66% |
88 |
|||
|
33% |
104 |
Table 1a: Testing of RF boards within enclosed space, without any obstruction
In the non-line-of-sight case, the signal strength deteriorated considerably when the RF boards had an obstruction between them. Table 1b below shows the observations as obtained with 3 kinds of obstructions: 1. A hand placed right in front of the board; 2. A human body in front of the board; and 3. An entrance door to the lab, with 1 board inside the lab, the other being out in the open.
|
S. No. |
Obstruction |
Antenna orientation |
Signal strength |
Distance (in feet) |
|
1 |
Palm |
Facing ahead |
100% |
5 |
|
66% |
85 |
|||
|
33% |
91 |
|||
|
2 |
Palm |
Sideways |
100% |
3 |
|
66% |
51 |
|||
|
33% |
75 |
|||
|
3 |
Body |
Facing ahead |
100% |
2 |
|
66% |
58 |
|||
|
33% |
84 |
|||
|
4 |
Body |
Sideways |
100% |
<1 |
|
66% |
20 |
|||
|
33% |
44 |
|||
|
5 |
Door* |
Facing ahead |
100% |
21 |
|
66% |
74 |
|||
|
33% |
94 |
|||
|
6 |
Door* |
Sideways |
100% |
23 |
|
66% |
48 |
|||
|
33% |
51 |
Table 1b: Testing of RF boards when separated by an obstruction
* Observations as on a cold day, with mild snow and wind
The measurements shown below in Table 2 were taken in an open space on flat terrain. The orientation of the antenna did not seem to affect the strength of the signal in this case. A low signal strength of 20% (or lesser) was available even at distances as far as 1110 feet. But for the signal strength to increase to 66%, the boards had to be atleast about 360 feet apart. 100% signal strength could only be obtained at really close distances of approximately 60 feet.
|
S. No. |
Antenna orientation |
Signal stength |
Distance (in feet) |
|
1 |
Any |
66% |
360 |
|
2 |
Any |
<=20% |
1110 |
Table 2: Testing of RF boards in open space
Bandwidth test on the Freescale transceiver
We developed custom code (using Metrowerks CodeWarrior IDE) for the bandwidth test. The test involved the transmission of a 64-byte packet from 1 board to another, on the receipt of which the second board would respond with a 4-byte ack-packet and then forward the 64-byte packet to the PC. The PC received the data at a rate of 1kbyte/s (8kbps), the data rate stayed at this level as long as the signal strength stayed above 50%. This test did not include piplelining of the transmissions which might increase the data rate to 4-fold even. The 8kbps data rate that we obtained is considerably lower than the Freescale-specified 240kbps rate. Besides, the Freescale product also has a limitation on the size of the packet being transmitted, if the packet size exceeded 64-bytes then it would be dropped.
Power measurements for the Freescale transceiver
We took power measurements to determine how much effect the LEDs and the RS-232 serial port had on the amount of power consumed by the device. It appeared that the RS-232 port needed a significant amount of power and the LEDs used a measureable quantity too. The power measurements we obtained were system power measurements, including the RS-232 port. The Freescale board does not have any provision to disconnect the RS-232 alone and take measurements to determine precisely how they affected the power consumption. The overall range was found to be 80-500mW, approximately. The details of the measurement are as shown in Table 3 below.
| Operating condition | Mode | Current (in mA) | Voltage (in V) | Power (in mW) |
|---|---|---|---|---|
| Full operation (with LEDs) | TX | 34 | 8.06 | 274 |
| RX (with RS-232) | 64 | 7.80 | 499 | |
| Full operation (without LEDs) | TX | 20 | 7.70 | 154 |
| RX (with RS-232) | 50 | 7.74 | 387 | |
| Low power operation | Clock off, waiting for interrupt | 10 | 7.90 | 79 |
Table 3: Power consumed by RF boards under different operating conditions
Signal strength measurements for Chipcon’s CC2420 transceiver
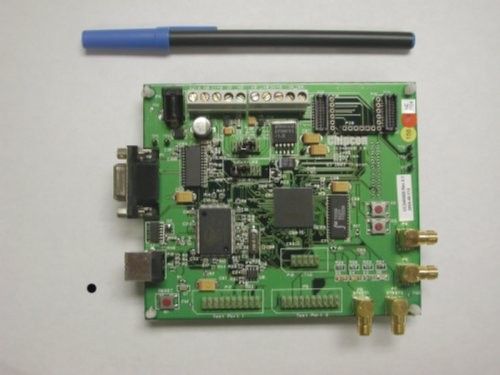
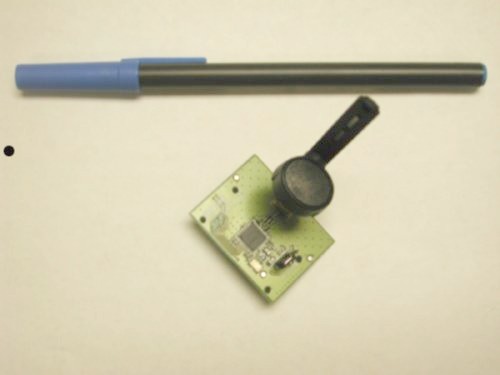
The CC2420DK Development Kit constituted 2 CC2400EB Evaluation Boards and 2 CC2420EM Evaluation Modules. The CC2420 chip was included in the CC2420EM board. The CC2400EB, which acted as the motherboard for the CC2420EM, consisted of a USB port, RS-232 serial port, DC power jack, voltage regulation, buttons, LEDs and jumpers for configuration purposes. The 2 boards are shown below, along with a 6-inch pen for comparison:
 |
 |
|---|---|
| CC2400EB Evaluation Board | CC2420EM Evaluation Module |
The signal strength test on the Chipcon boards was performed by transmitting one hundred 123-byte packets from one board to the other. 123 bytes was the maximum possible payload size that these boards could accomodate. After the completion of the transmission, we obtained all the transmission statistics from the receiver. The statistics included signal strength values (RSSI values in dBm), number of packets dropped and Percentage Error Rate (PER). According to the electrical specifications mentioned in the data sheet, the maximum range for the RSSI values was from -100dBm to 0dBm. In order to understand clearly what the dBm’s really meant, we converted them to percentage signal strength values.
The transmission statistics shown in Table 4a below were obtained by placing the transmitter and the receiver from 0 to 100 feet apart. This test was to obtain line-of-sight measurements, hence the 2 boards were not obstructed by anything. We conducted tests for distances as close as 5 feet (or lesser) in order to demonstrate how drastically the signal strength varied even with small changes in distance. Even in the best case (when both boards were placed less than a foot apart) the maximum attainable signal strength was only about -14.58 dBm. Due to this reason, we thought that it would be more practical to take this as 100% signal strength and hence all the percentage signal strength values shown in the tables below are based on keeping -14.58 dBm as the 100% mark. The real figures obtained are tabulated below, the orientation of the antennas for this part of the test was as shown in the figure below.
Antennas placed vertically, flat faces towards eachother
Antenna orientation: Vertical, with both flat faces facing eachother
| S. No. | Obstruction | Distance (in feet) | RSSI (in dBm) | RSSI (%) | Dropped packets (%) | Packet Error Rate (PER) (%) |
|---|---|---|---|---|---|---|
| 1 | None | < 1 | -14.58 | 100.00 | – | – |
| 2 | None | 1 | -23.46 | 89.60 | – | – |
| 3 | None | 5 | -52.60 | 55.48 | – | – |
| 4 | None | 25 | -62.39 | 44.03 | – | – |
| 5 | None | 50 | -74.77 | 29.54 | – | – |
| 6 | None | 75 | -79.80 | 23.65 | – | – |
| 7 | None | 100 | -95.00 | 5.85 | 33 | 97 |
| -94.50 | 6.44 | 38 | 96 | |||
| -94.00 | 7.02 | 54 | 97 |
Table 4a: Line-of-sight signal strength test (no obstruction, face-to-face orientation)
It seems from Table 4a above that at distances of about 100 feet, with the antennas oriented vertically facing eachother, the signal strength is really poor. At this distance, there is also a considerable percentage of dropped packets and the error rates are almost 100%. Table 4b (below) shows the measurements as obtained in the non-line-of-sight case. We used several obstructions like a palm wrapped around the transmitter’s antenna, a body covering the antenna and a door separating the transmitter placed in one room from the receiver placed in another. It seems like for distances as far apart as 75 feet or more, the percentage dropped packets and PER are pretty high. These numbers seem to vary quite a bit, which is probably because of the fact that the obstructions used cannot obstruct the antenna in the exact same way on any 2 consecutive occasions, hence allowing the RF waves to form different patterns each time. It also seems like at closer distances (like 25 feet) the palm seems to be a better obstruction (hence leading to a lower signal strength) than the body. This again may be because the RF waves may be capable of getting around a body and forming circular wave patterns sufficient to reach antennas 25 feet away or so. But a palm wrapped around the antenna is probably a better obstruction. For distances of 50 feet and closer, there are no dropped packets or packet errors inspite of any kind of obstruction. And doors and walls do not seem to have an impact on signal strengths as well as on packet drop rates and error rates.
Antenna orientation: Vertical, with both flat faces facing eachother
| S. No. | Obstruction | Distance (in feet) | RSSI (in dBm) | RSSI (%) | Dropped packets (%) | Packet Error Rate (PER) (%) |
|---|---|---|---|---|---|---|
| 1 | Palm | 100 | -93.80 | 7.26 | 68 | 68 |
| -92.93 | 8.28 | 37 | 76 | |||
| -93.22 | 7.94 | 48 | 55 | |||
| 2 | Palm | 75 | -83.13 | 19.75 | 73 | 40 |
| -81.12 | 22.10 | 69 | 16 | |||
| -81.67 | 21.46 | 84 | 6 | |||
| 3 | Palm | 50 | -79.96 | 23.46 | – | – |
| -80.75 | 22.54 | – | – | |||
| -83.12 | 19.76 | – | – | |||
| 4 | Palm | 25 | -79.70 | 23.76 | – | – |
| -80.41 | 22.93 | – | – | |||
| -82.83 | 20.10 | – | 2 | |||
| 5 | Body | 100 | -93.69 | 7.39 | 38 | 58 |
| -92.24 | 9.08 | 48 | 36 | |||
| -92.43 | 8.86 | 27 | 30 | |||
| 6 | Body | 75 | -89.72 | 12.03 | 34 | 34 |
| -91.25 | 10.24 | 41 | 25 | |||
| -90.41 | 11.23 | 19 | 16 | |||
| 7 | Body | 50 | -80.23 | 23.14 | – | 2 |
| -83.46 | 19.36 | 1 | 1 | |||
| -85.25 | 17.27 | – | 1 | |||
| 8 | Body | 25 | -70.27 | 34.80 | – | – |
| -67.35 | 38.22 | – | – | |||
| -67.35 | 38.22 | – | – | |||
| 9 | Door | 100 | -83.96 | 18.78 | – | – |
| -84.64 | 17.98 | 1 | 1 | |||
| -83.06 | 19.83 | – | – |
Table 4b: Signal strength test in the non-line-of-sight case (multiple types of obstructions, face-to-face orientation)
Table 5 below shows RSSI values as obtained when the 2 antennas were both placed vertically, but with their horizontal axes 90 degrees apart. It seems like this orientation is better suited with respect to getting a higher signal strength for the longer distances and especially with respect to getting a lower percentage of dropped packets. This can probably be attributed to the way in which the RF waves spread out when 1 antenna is placed sideways and the other in an orthogonal position to it. Even in this orientation though, an obstruction such as a palm or a body becomes a significant factor for distances of 75 feet or more. Doors and walls, once again, do not seem to be issues for distances of upto 100 feet. The antennas were oriented as shown in the figure below.
Antennas placed vertically, flat face of one facing the thin face of the other
Antenna orientation: Vertical, with one antenna’s flat face facing the other antenna’s thin face
| S. No. | Obstruction | Distance (in feet) | RSSI (in dBm) | RSSI (%) | Dropped packets (%) | Packet Error Rate (PER) (%) |
|---|---|---|---|---|---|---|
| 1 | None | 100 | -91.25 | 10.24 | – | – |
| -91.31 | 10.17 | 1 | 1 | |||
| -91.32 | 10.16 | – | – | |||
| 2 | None | 75 | -92.65 | 8.60 | – | 3 |
| -92.37 | 8.93 | 3 | 5 | |||
| -92.34 | 8.97 | – | 9 | |||
| 3 | None | 50 | -81.54 | 21.61 | – | – |
| -82.36 | 20.65 | – | – | |||
| -82.00 | 21.07 | – | – | |||
| 4 | None | 25 | -68.43 | 36.06 | – | – |
| -69.20 | 36.06 | – | 1 | |||
| -68.41 | 36.98 | – | – | |||
| 5 | Palm | 100 | -91.27 | 10.22 | 46 | 79 |
| -93.14 | 8.03 | 26 | 51 | |||
| -92.64 | 8.62 | 74 | 57 | |||
| 6 | Palm | 75 | -89.89 | 11.84 | 23 | 29 |
| -91.09 | 10.43 | 41 | 61 | |||
| -91.53 | 9.92 | 45 | 34 | |||
| 7 | Palm | 50 | -81.81 | 21.29 | 2 | – |
| -84.11 | 18.60 | 2 | 2 | |||
| -86.78 | 15.48 | 3 | 1 | |||
| 8 | Palm | 25 | -76.11 | 27.97 | – | – |
| -73.81 | 30.66 | – | – | |||
| -79.57 | 23.92 | – | – | |||
| 9 | Body | 100 | -93.54 | 7.56 | 68 | 59 |
| -92.81 | 8.42 | 58 | 61 | |||
| -93.00 | 8.19 | 53 | 89 | |||
| 10 | Body | 75 | -87.38 | 14.77 | 1 | 4 |
| -86.72 | 15.55 | – | – | |||
| -86.89 | 15.35 | – | 1 | |||
| 11 | Body | 50 | -86.11 | 16.26 | 2 | 2 |
| -80.13 | 23.26 | 2 | 1 | |||
| -83.35 | 19.49 | – | 2 | |||
| 12 | Body | 25 | -76.74 | 27.23 | – | 1 |
| -71.48 | 33.39 | – | 1 | |||
| -82.92 | 20.00 | – | 4 | |||
| 13 | Door | 100 | -82.06 | 21.00 | – | – |
| -82.03 | 21.04 | – | – | |||
| -82.06 | 21.00 | – | – |
Table 5: Signal strength test with and without obstructions (orthogonal orientation)
Table 6 below shows RSSI values that were obtained for yet another orientation of the antennas, 1 placed vertical with its wide face facing ahead, the other placed horizontal in an orthogonal direction (as shown in the figure below). On comparing this orientation with the previous two, it appears like this orientation proves to be better with respect to the percentage of packets dropped and the PERs. This could probably be explained by the fact that when 1 antenna is placed horizontally, pointing ahead, its RF waves spread further (in one direction) and hence increasing its coverage, reducing the number of packets dropped and the error rates.
One antenna in vertical position, the other horizontal
Antenna orientation: One antenna verically placed with flat face ahead, the other antenna horizontally placed and pointing ahead
| S. No. | Obstruction | Distance (in feet) | RSSI (in dBm) | RSSI (%) | Dropped packets (%) | Packet Error Rate (PER) (%) |
|---|---|---|---|---|---|---|
| 1 | None | 100 | -90.80 | 10.77 | – | – |
| -90.52 | 11.10 | – | 1 | |||
| -91.59 | 9.85 | – | 1 | |||
| 2 | None | 75 | -89.12 | 12.74 | – | – |
| -90.53 | 11.09 | – | – | |||
| -89.88 | 11.85 | – | – | |||
| 3 | None | 50 | -70.13 | 34.97 | – | – |
| -70.19 | 34.90 | – | 1 | |||
| -70.01 | 35.11 | – | – | |||
| 4 | None | 25 | -70.88 | 34.09 | – | – |
| -71.05 | 33.89 | – | – | |||
| -71.09 | 33.84 | – | – | |||
| 5 | Palm | 100 | -92.18 | 9.16 | 3 | 18 |
| -92.27 | 9.05 | 4 | 21 | |||
| -92.93 | 8.28 | 9 | 35 | |||
| 6 | Palm | 75 | -91.91 | 9.47 | 20 | 13 |
| -90.16 | 11.52 | 26 | 16 | |||
| -91.58 | 9.86 | 21 | 54 | |||
| 7 | Palm | 50 | -84.85 | 17.74 | 7 | 5 |
| -85.31 | 17.20 | – | 1 | |||
| -82.26 | 20.77 | 1 | 1 | |||
| 8 | Palm | 25 | -77.47 | 26.38 | – | – |
| -72.09 | 32.67 | – | – | |||
| -68.45 | 36.94 | – | 1 | |||
| 9 | Body | 100 | -93.17 | 8.00 | 76 | 50 |
| -91.00 | 10.54 | 76 | 41 | |||
| -91.95 | 9.42 | 74 | 26 | |||
| 10 | Body | 75 | -90.55 | 11.06 | 1 | 3 |
| -87.60 | 14.52 | – | 3 | |||
| -85.04 | 17.51 | 10 | 1 | |||
| 11 | Body | 50 | -81.57 | 21.58 | – | 1 |
| -83.78 | 18.99 | 4 | 3 | |||
| -80.35 | 23.00 | – | – | |||
| 12 | Body | 25 | -69.20 | 36.06 | – | 1 |
| -72.75 | 31.90 | – | – | |||
| -71.33 | 33.56 | – | – | |||
| 13 | Door | 100 | -91.33 | 10.15 | 46 | 83 |
| -91.00 | 10.54 | 37 | 84 | |||
| -95.00 | 5.85 | 56 | 97 |
Table 6: Signal strength test with and without obstructions (vertical-horizontal orientation)
We took power measurements for these Chipcon boards and found that the values for both RX and TX power matched with the specifications on their data sheet.
Comparison of the Freescale and Chipcon boards
From the above signal strength tests it seems like the Freescale boards can maintain 100% signal strength for larger distances. But if we consider reliability, the Chipcon boards seem to be better. Although they don’t really maintain a very high signal strength for longer distances, they seem to be more reliable with respect to delivering the packets to the destination, with a low packet error rate. Even obstructions (especially doors and walls) don’t seem to affect the Chipcon boards’ performance as much as they affect Freescale’s. It therefore appears to be quite obvious that the Chipcon boards would be a better choice among the two.
Integration of the Freescale board with NAVSYS TrackTag device
We currently have a NAVSYS TrackTag connected to our Freescale demonstration board. Communication between the TrackTag and Freescale MCU has been established at a baud rate of 125kbaud. Full communication over the zigbee link has been established with TrackTag commands and 2kbyte TrackTag packet downloads.
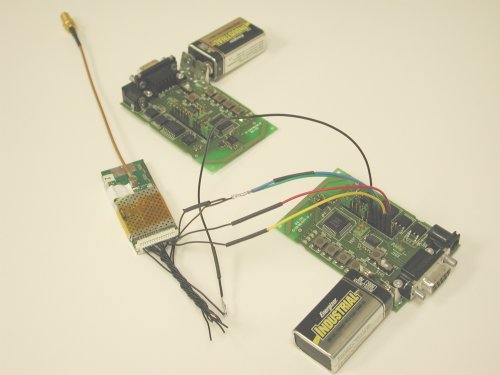
NAVSYS TrackTag integrated with Freescale board
Zigbee gateway module
We researched extensively to determine if there were any standards with regard to a zigbee gateway. Although there are several companies which have developed their own zigbee gateway products, there are no standard specifications in place yet. The Zigbee Alliance is working on setting up standards for a zigbee gateway though. On contacting the chairman of the Zigbee Gateway Working Group of the Zigbee Alliance, Mr. Pat Kinney, we found out that they are currently working on 2 projects:
- PAN Expansion Device (PED): A bridge to connect 2 zigbee devices via an IP network, and
- Zigbee gateway: A full-fledged gateway to connect a zigbee device with a non-zigbee device via an IP network
The PED specification is expected to be ready by September 2005 and the gateway specification is to follow.
In the absence of any standards as of now, we started working on our own implementation of a Zigbee gateway. The general idea in this section was that GPS data would be transmitted across several zigbee nodes before it reached the zigbee gateway module. At the gateway, the GPS data would be read in from the serial port by the gateway server. This data would then be sent over the IP network and made accesible to clients via a webpage. This system has been developed and tested with raw hex data.