The Need of the Hour
Each morning, when we read the daily newspaper, there is always some news or the other on terrorism and terrorist activities around the world. This is probably the only issue, unfortunately, that features on the papers on a fairly regular basis. These current circumstances have lead us to such a stage that it has become absolutely essential to devise methods of detecting anti-social activities at an early stage. This is what makes our project so interesting and essential, catering to the needs of the Northern Command, to come up with a method of detecting Chemical and Biological warfare agents in maritime cargo.
Project Breakdown
The project was broken up into 3 separate phases, with each phase giving leads on how to approach the phase that followed next. The first of the 3 phases involved an exhaustive research on the several chemical agents that were categorized as hazardous chemicals. Months of research went into determining information on the behavior and the various physical and chemical properties of these Chemical Warfare Agents (CWA). Material Safety Data Sheets (MSDS) were obtained, which gave a lot of useful information about the CWAs. Please refer to Table 1 below to view some helpful data from one such online resource that gives us plenty of information related to the physical and chemical properties of several chemical warfare agents.

Reproduced with permission from Environmental Health Perspectives, http://ehp.niehs.nih.gov
Some of the information obtained gave us an insight into the toxicological details of the nerve agents, the lethal exposure limits, how they would affect humans, what sort of symptoms to look out for incase of exposure and how a person exposed to CWAs is to be treated. Pharmacological details from some of the resources gave us sufficient knowledge on how these chemical agents affected the human body. We also got details on various simulants that are normally used as substitutes for the chemical agents in experiments performed in laboratories.
Existing Detection Techniques
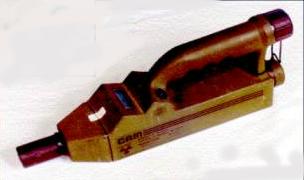
In the course of our research, we came across several methods of chemical agent detection, some of which are not just studies but are actually being implemented. A portable device, called the Chemical Agent Monitor (CAM), is used to detect nerve and blister agents. Figure 1 below should give an idea of the appearance of this device.

Figure 1: Chemical Agent Monitor; Reproduced with permission from www.nbc-links.com
The CAM is pretty compact and portable, it needs the user of the device to be appropriately attired in protective gear. Its sensitivity varies from 0.016 ppm for GA (Tabun) to 0.026 ppm for GB (Sarin).
The HAZMATCAD is yet another device used to detect blister and nerve agents. It is a handheld device that uses a set of 3 Surface Acoustic Wave (SAW) sensors. These SAW sensors respond to different chemicals (or classes of chemicals) in a unique way, giving out an alarm (both audible and visible) when the detected chemical agent(s) exceeded preset values for safe levels. Please click on Figure 2 to get a picture of how the HAZMATCAD looks.
The HAZMATCAD was tested on several chemicals in different modes of operation (Fast mode and High Sensitivity mode). Its sensitivity was observed to vary in the range of 0.02 ppm for GA (Tabun) to 0.19 ppm for HD (Sulphur Mustard).
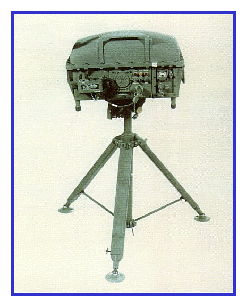
The next CWA detector that we will be talking about is the Remote Sensing Chemical Agent Alarm (RSCAAL). This device, shown in Figure 3 below, is used to detect nerve and vesicant agents. The RSCAAL is different from the other instruments discussed so far, in that it is used to detect chemical agents from far away. It can detect CWAs from a distance of about 5 kms (3.11 miles, approximately) away, hence eliminating the need for the users of the device to be in protective gear.

Figure 3: Remote Sensing Chemical Agent Alarm; Reproduced with permission from www.nbc-links.com
The sensitivity of RSCAAL was measured in a unit called Concentration Time. It varied from 3 mg-min per cubic metre for nerve agents to 150 mg-min per cubic metre for blister agents.
Our Study
Our work is specifically related to hazardous chemicals transported in maritime cargo and detecting leaks in them when in transit. Goods that are a part of maritime cargo are normally transported in huge containers. A picture of a few containers can be seen by clicking on Figure 4a. These containers are also available in various dimensions, as can be seen by clicking on Figure 4b. These containers carry smaller packaging consisting of the various materials being transported. The smaller packages can be of any kind, they vary from the likes of cylinders and drums to boxes of different types.
When a chemical leaks from one (or more) of these internal packages, it will spread around the insides of the container. The motion of the chemial depends on its properties, such as its volatility and its diffusive characteristics. These properties give us information on how the chemical would diffuse into its surroundings, given that it escapes at a specific rate from a certain part of the packaging. The answers to such questions help us determine the sesitivity to which our sensors should be designed. A more complex case would be if there is more than one chemical being transported in each container. In such a situation, each of the chemicals would show a different leakage behavior. We can account for different chemicals by placing multiple sensors in different parts within the container, in this way we would have take into consideration the leakge pattern followed by the various chemicals inside it.
We are currently working on designing a computational model for determining the behavior of the chemicals, on leakage. An important consideration at this stage is the most optimum and safest position for placing the sensors within the container. Depending on the physical and chemical properties of the chemical under consideration, if a leak occurs then that chemical might either move towards the bottom or the top of the container. For example, if a chemical is heavy, it would settle at the bottom of the container, on the other hand, if it is light, then the chemical would tend to rise to the top of the container. This would help in finding out in which part of the container would it be most probable to detect the presence of a chemical, incase a leak does occur. Our current work involves all of these issues. We now have a computational model that gives us a graphic of the various concentration levels at different parts inside the container, given the geometry of the packaging in the container (whether a box is used, or a cylinder or any other packaging of a different shape) and the source(s) of leakage along with the leakage rate of a particular chemical. We are currently working on improving on the model such that it can accomodate a package of any shape or size, and also determine the concentrations for different leakage rates originating at different parts of the packaging within the container.
Simulation Model
The model that we are using to determine the concentration of the chemicals is based on certain diffusion equation relations known as Fick’s laws. More specifically, we have used Fick’s second law in our code for the computational model. Fick’s second law relates the second order partial dereivative of the concentration of a given chemical with its rate of change of concentration and the diffusivity of that chemical. If this subject sounds interesting, please click on Diffusion and Fick’s laws to read more about it (hopefully, this link is still active).
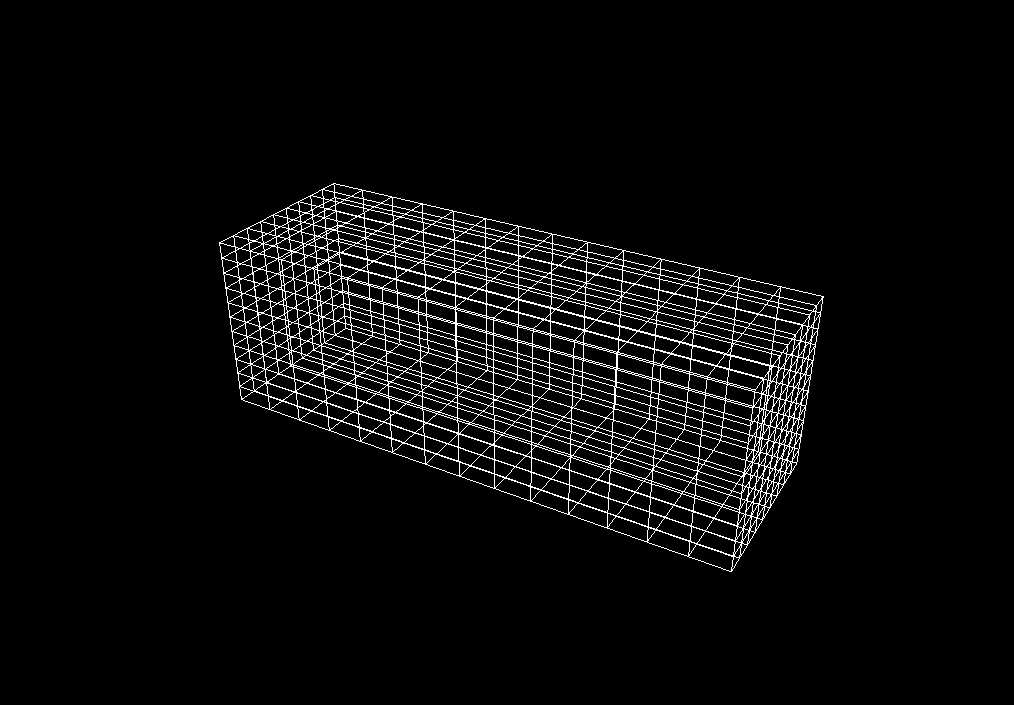
Our simulation model consists of 3 parts. In the first part, we defined the geometry of the large outer container consisting of smaller inner containers (to hold the chemicals). A volume mesh is then generated within the large container, this divides the whole container into a collection of several smaller boxes so that the concentration of the chemical can be determined at the vertices of each of these boxes. This would help determine how the chemicals spread around the container. A picture of the container along with its volume mesh is shown below, in Figure 5.

Figure 5: Container with its volume meshing complete
The geometry created above is then passed as an input to the second part of the code. The second part is a Partial Differential Equation (PDE) solver. It solves the second order PDE (defined based on Fick’s law) for the concentration of the chemical around the insides of the container. The source of leakage is passed to the PDE as a boundary condition to it, and the solver determines the solution to the equation by applying the boundary condition over the PDE. Multiple points of leakage can be defined as multiple boundary conditions to the PDE.
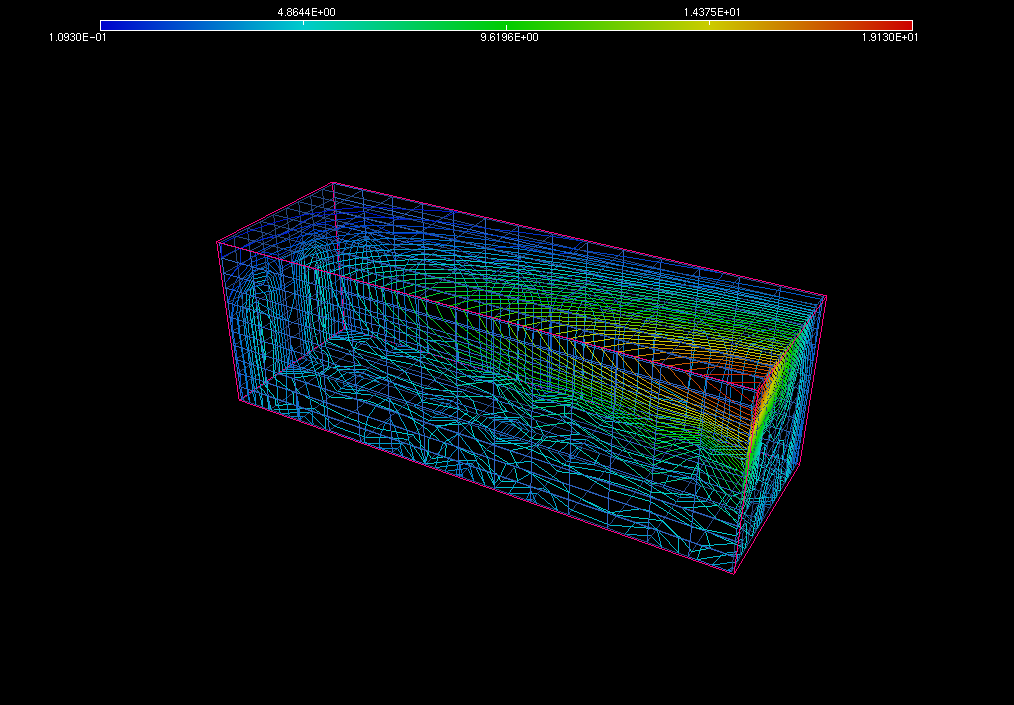
The third part of the simulation consists of the creation of a visualization to show the interiors of the container and the distribution of the chemical around the interiors. This picture (shown below in Figure 6) depicts the different concentration values using different colors. In the figure below, for instance, the colors range from blue to red, with blue indicating the minimum concentration and red indicating the maximum concentration of the chemical under consideration in that area of the container. The pink outer box is the bounding box that is used by the solver in order to solve the PDE.

Figure 6: Distribution of the chemical around the interiors of the large container
On completing the computational model to our satisfaction, we will start to work on the third and final phase of this project. We propose to design Micro Electro Mechanical Sensors, abbreviated as MEMS, using all the data obtained from our work above and also incorporating all the useful information from the various other studies discussed previously. Our computational model should give us a good idea of the sensitivity to which our sensors should be designed. We would also be able to determine the best position for the sensors within the containers, with the help of our simulation.
This project has been very interesting to work on so far, we now look forward to getting to the final phase of our work which would involve the design and testing of the MEMS sensors.
